Fuel retail remains one of the most geographically distributed industries in the United States. From dense urban corridors to remote interstate routes, fuel stations form a critical backbone of mobility and commerce. This report analyzes the distribution of nearly 148,000 retail fuel stations across all U.S. states, highlighting where fuel infrastructure is most concentrated and where opportunity still exists.
148K+
TOTAL RETAIL FUEL STATIONS
17.3%
27%
THE BIG PICTURE
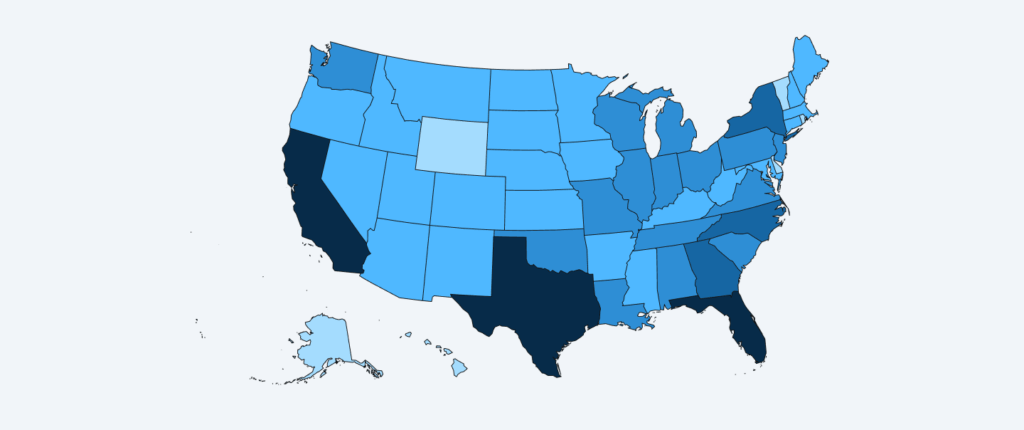
Two Americas, one fuel network
Texas dominates by volume
Texas operates the largest retail fuel network in the country, with nearly 15,000 stations — almost 10% of the entire national infrastructure – driven by its enormous land area, population, and freight demand.
14,895
stations in Texas alone
The lagging 30%
“Station density reflects where America drives. AI adoption reveals where the industry is heading. The gap between the two is this decade’s defining competitive fault line.”
78.4%
10X
5 States
AI Adoption Framework
Four tiers shaping the future of fuel retail
Based on U.S. Census BTOS data and corroborating research, we classify every state into one of four AI adoption tiers – each reflecting materially different competitive trajectories.
Leading
23%+
Tech-hub states deploying AI across pricing, inventory, and customer experience. Policy frameworks in CA and NY signal long-term commitment.
Growing
17-23%
States with active tech ecosystems and growing adoption. TX, FL, and IL are particularly significant given their large station counts.
TX, FL, IL, MD, MA, OR, NC, WY, AZ + more
Emerging
14-17%
Industrializing and transitioning economies. Manufacturing legacy creates structural drag but select metros are driving local adoption curves.
AL, IN, MI, OH, TN, MO, SC, GA + more
Lagging
<14%+
Predominantly rural, agricultural, or coal-dependent states. These markets face widening competitive gaps as peer states accelerate. NJ is a surprising outlier.
MS, AR, WV, ME, ND, LA, NJ, WI, NE + more
Bubble size proportional to number of fuel stations. Color indicates adopter tier.
- Leading
- Growing
- Emerging
- Lagging
Regional Analysis
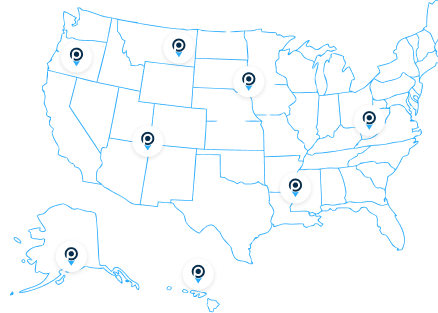
Regional fuel & AI adoption patterns
Fuel station distribution and AI uptake follow distinct regional patterns driven by population density, economic composition, and proximity to technology hubs.
South
TX, FL, GA, AL, MS, LA, AR, TN, SC, NC, KY, WV, VA, MD, DE, OK
56K
STATIONS
AVG AI ADOPTION
West
CA, WA, OR, CO, NV, AZ, UT, ID, MT, WY, AK, HI, NM
15.6%
STATES LAGGING
Northeast
NY, PA, NJ, MA, CT, RI, NH, VT, ME, DC
Data Visualization
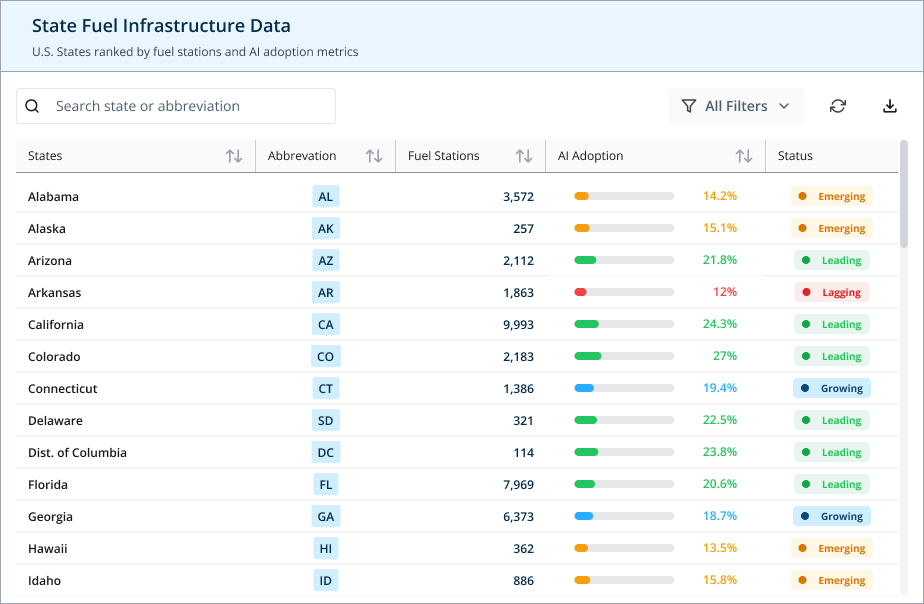
Top states by station count & AI adoption
The top 15 states by fuel station volume – overlaid with their AI adoption rates – reveal the disconnect between market size and technology readiness.
- Leading
- Growing
- Emerging
Colored by AI adoption tier
- Leading
- Growing
- Emerging
- Lagging
States where AI adoption outpaces station density are best positioned for the next decade.
Looking Ahead
The U.S. fuel retail market is becoming more dynamic and competitive.
Station density is shaping how operators price, compete, and grow.
The retailers who succeed will be those who can:
- React faster
- Execute consistently
- Connect decisions across their entire network
How PriceEasy fits into your system
Convenience retail is a complex, fast-moving ecosystem – where fuel pricing, in-store performance, operations, and location strategy are deeply interconnected. PriceEasy sits at the center of this ecosystem, turning fragmented data into coordinated action. Instead of siloed decisions, operators get a unified system that drives smarter pricing, stronger margins, and better in-store outcomes – at scale, across every location.
Fuel IQ
Price IQ
Conversion IQ
Location IQ
AI Manager
One connected platform, built to drive margin, growth, and execution across every store.
Sources & Methodology
Compiled from industry datasets
Fuel station counts are derived from EIA retail fuel station data by state. AI adoption rates are modeled from the U.S. Census Bureau’s Business Trends and Outlook Survey (BTOS), which surveys 1.2 million U.S. businesses bi-weekly. State-level firm-adoption percentages from the Bipartisan Policy Center analysis (Dec 2023–Feb 2024 BTOS supplement) have been scaled to a broader business AI adoption range cross-referenced with McKinsey (78% enterprise AI use, 2024), SmartAsset AI Adoption by State 2026, and Motley Fool BTOS analysis. Adopter tiers (Leading/Growing/Emerging/Lagging) are editorial classifications based on adoption percentile bands and corroborating qualitative factors including state tech policy, industry composition, and projected use rates. All figures represent best estimates as of Q1 2026.
FAQ
Which states have the highest number of fuel stations?
States with larger populations and higher vehicle dependency, such as Texas, California, and Florida, typically have the highest concentration of fuel stations, creating more competitive pricing environments.
Why does fuel station density matter for pricing?
Higher station density increases competition, leading to more frequent price changes and tighter margins. Operators in these markets must react quickly to competitor pricing to remain competitive.
What challenges do fuel retailers face in high-density markets?
Margin pressure
Increased need for real-time pricing decisions
Operational complexity across multiple sites
How do low-density markets differ?
How can PriceEasy help fuel retailers?
PriceEasy helps operators:
- Monitor competitors in real time
- Automate pricing decisions
- Ensure accurate execution across all sites
- Connect fuel pricing with in-store performance
Explore Your Market with PriceEasy
Discover how PriceEasy helps fuel retailers respond faster to market changes, protect margins, and execute pricing decisions with confidence.


 by PriceEasy